Dashboard
A preview of your future control room
Illustrative sample data from a 12-acre demo farm running four irrigation zones.
Dashboard
Your whole farm, on one screen
Live sensor readings, historical trends and the next irrigation action, all in one view. Shown here with sample data.
0%
Current Soil Moisture
0%
Tank Level
0°C
Temperature
0%
Humidity
0 L
Today's Water Usage
Idle
Motor Status
Soil Moisture Trend (24h)
Water Consumption (litres)
Temperature History
Rain Forecast (probability %)
Irrigation Schedule
| Zone | Start | Duration | Status |
|---|---|---|---|
| Zone 1 · Tomato | 05:30 | 18 min | Completed |
| Zone 2 · Chilli | 06:10 | 12 min | Completed |
| Zone 3 · Banana | 17:45 | 22 min | Running |
| Zone 4 · Fodder | 19:00 | 15 min | Scheduled |
Farm monitoring map
Every sensor, pipeline and pump — geo-located
Walk your farm digitally. Tap any node for live readings, battery health and last sync time.
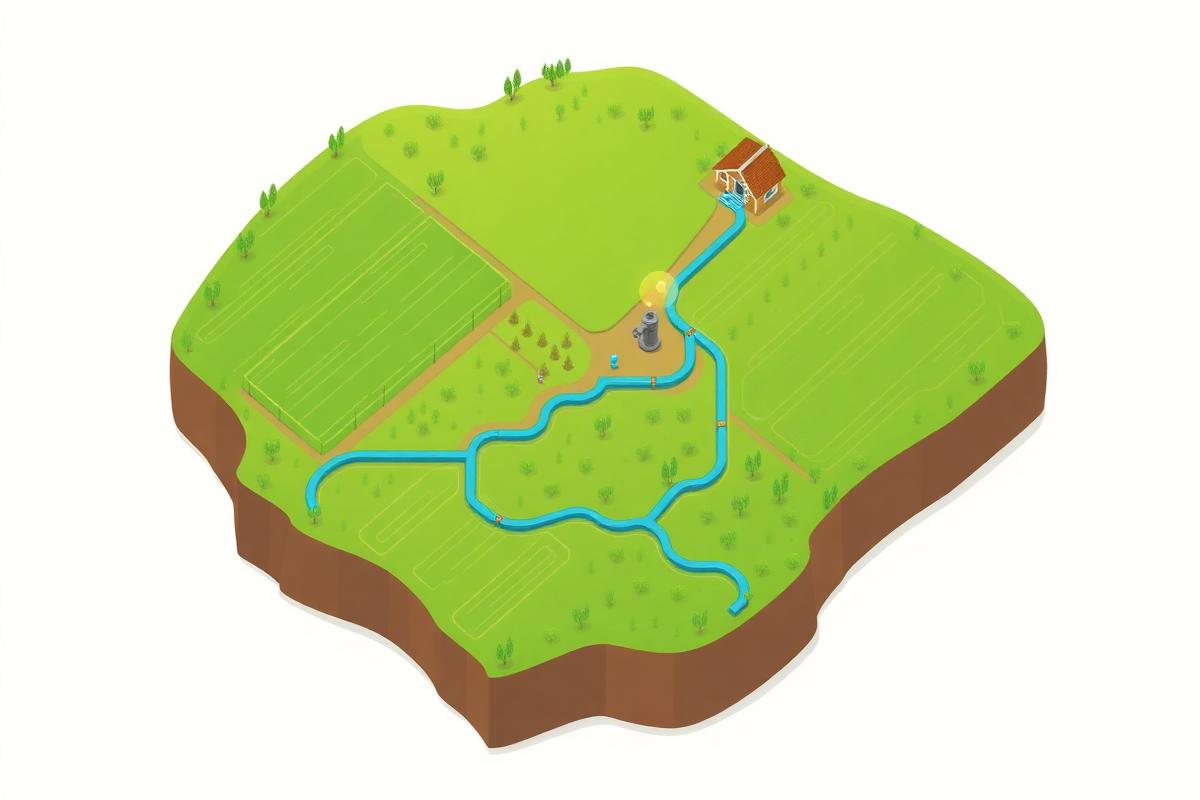
Live sensor status
- Soil sensor · Zone 1
- Soil sensor · Zone 2
- Water tank · 82%
- Pump house · Running
- Flow meter · 2.4 m³/h
Ready to cut your water bill by 40%?
Get a free sensor layout plan and a savings estimate for your farm — no commitment, no hardware purchase required to start.